What is M9.?#
Margin-9 (M9.) is a professional position sizing study for Sierra Chart that automatically calculates the optimal contract quantity for each trade. The study analyzes the distance between entry price and stop-loss in real-time and adjusts the position size to maintain your predefined risk budget per trade.
Built for serious futures traders, M9. combines sophisticated position sizing calculations, intelligent multi-target contract distribution, a dynamic risk-to-reward display, and a self-managed order engine that builds and manages the full bracket — entry, protective stop, and take-profits — without relying on Sierra Chart's attached orders.
Problem it Solves#
Proper position sizing is one of the most critical aspects of risk management. Many traders use the same contract quantity for every trade, regardless of how far the stop-loss is from the entry. This leads to inconsistent risk: tight stops result in less risk, while wide stops expose significantly more capital than intended.
M9. solves this problem by automatically adjusting contract quantity so that the dollar risk (or percentage of account balance) remains constant for every trade.
Intelligent Position Sizing Engine#
At the heart of M9. is a sophisticated position sizing engine that performs complex calculations to determine the precise number of contracts for each trade. The study considers multiple variables and executes robust mathematical operations to deliver the most accurate results possible.
Core Calculation Formula
Contracts = Risk Amount / (Stop Distance in Ticks × Tick Value)The study continuously monitors entry price and stop-loss placement, recalculating position size in real-time as you adjust your orders. This ensures your risk remains constant even when you move your stop after placing an entry order.
Fixed Dollar Risk
Set a fixed amount (e.g., $250) that remains constant regardless of account size. Ideal for traders who prefer absolute risk limits per trade.
Percentage of Account
Risk a percentage of your live account balance (e.g., 1%). Position size automatically scales as your account grows or shrinks. Available in live trading mode only.
Real-Time Recalculation
Prefer a fixed size? (v2.9.1)
5 for five contracts, or 75% for percentage risk). Fixed counts are still capped to your Max Contracts limit. Handy for mechanical strategies or quick manual sizing.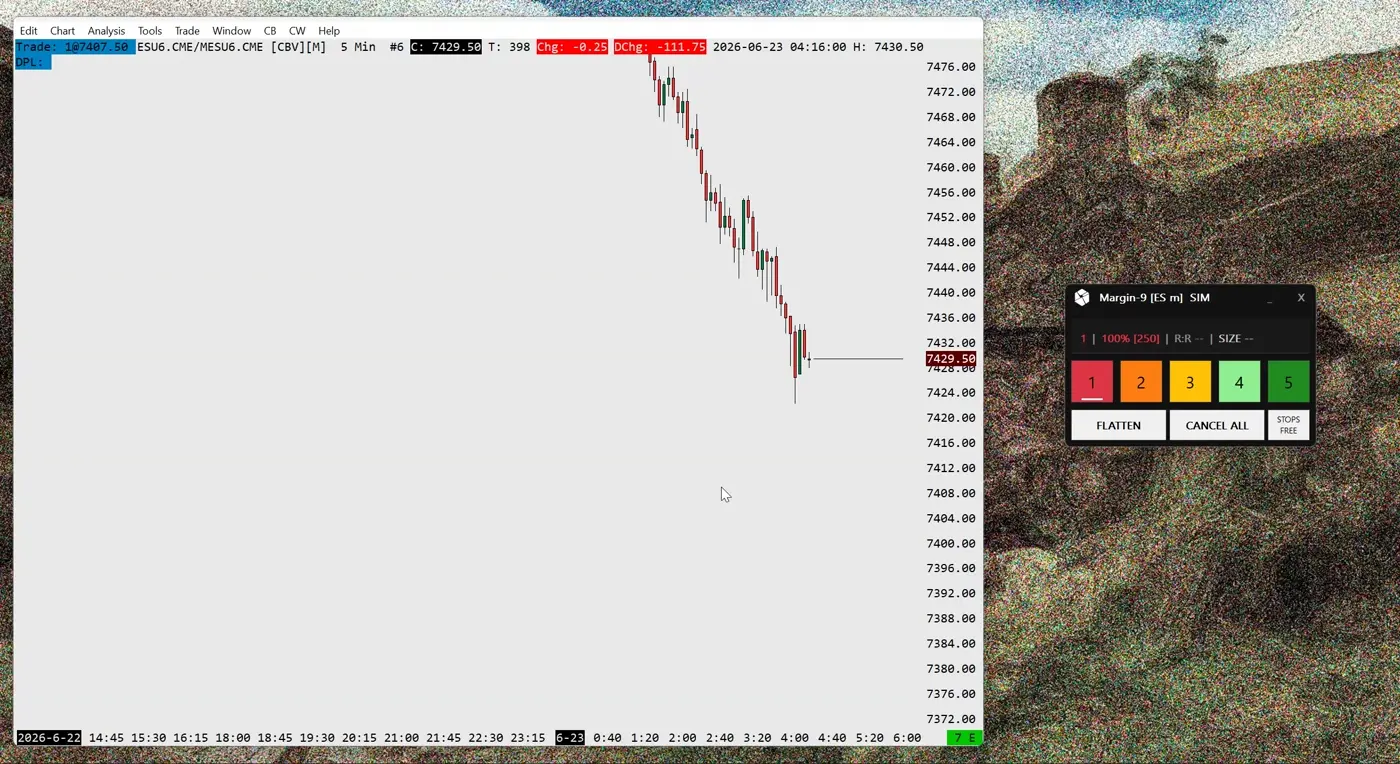
Advanced Multiple Targets System#
M9. features a powerful multi-target system that gives you complete control over how contracts are distributed across your take-profit levels. Each target can receive a fully customizable percentage of your total position, and the study performs intelligent rounding to ensure every contract is precisely allocated.
Example: 10 Contracts with 50/30/20 Distribution
5
TP1 (50%)
3
TP2 (30%)
2
TP3 (20%)
The study handles fractional rounding intelligently, ensuring total contracts always match
How It Works
- ●Per-Profile Distribution: Each of your 5 risk profiles can have its own unique TP distribution (e.g., Profile 1: "50,30,20", Profile 2: "100")
- ●Intelligent Rounding: When contracts can't be evenly divided, the study uses a smart algorithm to distribute remainders fairly across targets
- ●Limit-Aware Redistribution: If max contract limits reduce your position, the distribution is automatically recalculated to maintain your target percentages
- ●Real-Time Updates: The SIZE display in the control panel shows your current contract distribution (e.g., "[5,3,2]") at all times — and a click on it switches the readout to secured R-multiples or ATR distances (v3.4.0+)
Same Precision for Both Risk and Targets
Dynamic Risk-to-Reward Display#
The R:R (Risk-to-Reward) display is one of M9.'s most sophisticated features. Unlike simple R:R calculators that assume equal contract distribution, this display performs weighted calculations that account for your actual contract allocation across multiple targets.
Weighted R:R Calculation
Weighted Reward = Σ (TP Distance × Contracts at TP) / Total Contracts
R:R = Weighted Reward / Risk Per Contract
This formula ensures the displayed R:R accurately reflects your expected return based on how contracts are distributed across your take-profit levels.
Live Adaptation
The R:R display continuously adapts to changing market conditions and order modifications:
- ●Updates when you place or modify entry orders
- ●Recalculates when stop-loss is moved
- ●Adjusts when take-profit targets are repositioned
- ●Reflects partial fills as targets are hit during the trade
< 1.5R
Consider adjusting targets
1.5R - 2.0R
Acceptable risk/reward
> 2.0R
Favorable trade setup
Forward Reward-to-Risk (FRR)#
When you move your stop into profit (above entry for longs, below entry for shorts), the classic R:R ratio becomes irrelevant. M9. automatically switches to Forward Reward-to-Risk (FRR) — a metric that measures your profit potential relative to your remaining risk from the current price. Available since v1.3.2.
FRR Formula
FRR = (Take Profit - Current Price) / (Current Price - Stop)This formula calculates how much profit potential remains relative to the risk of giving back unrealized gains. A higher FRR means more upside with less risk of losing your locked-in profit.
Classic R:R (2.5R)
Displayed when stop is at risk (below entry for longs). Measures reward from entry pricerelative to initial risk amount.
Forward R:R (2.5F)
Displayed when stop is in profit. Measures remaining reward from current pricerelative to the risk of losing your locked-in profit.
FRR Color Scale
The FRR display uses a dynamic color scale to indicate trade quality at a glance:
≥ 3.0F
Excellent
≥ 2.0F
Very Good
≥ 1.5F
Good
≥ 1.0F
Acceptable
< 1.0F
Unfavorable
Trade Management Insight
Entry Modes & Order Engine#
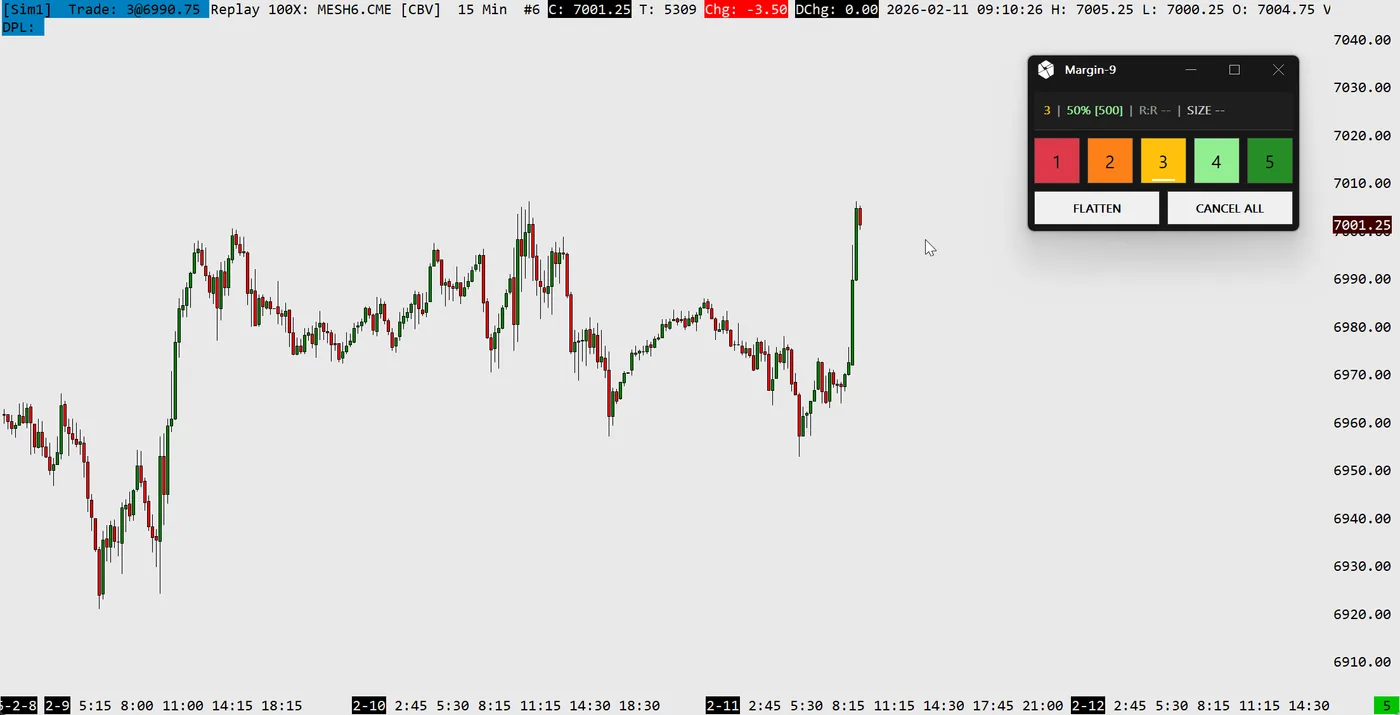
Margin-9 runs its own order engine: it builds, tracks, and manages the full bracket — entry, protective stop, and take-profits — in both Simulation and Live trading. You choose how each trade is started through five optional entry modes, all off by default:
Chart-Click
Hold a key and left-click the chart — the click places a risk-sized bracket exactly where you point, with a live preview following your cursor.
Pair Adoption
Place your own limit entry and protective stop; Margin-9 adopts the pair as-is, sizes it to your risk, and stages the take-profits.
Market
Set a protective stop while flat and enter at market with one button — targets are pre-staged with live risk-to-reward.
Breakout
A bracketing stop pair becomes the breakout entry: one side enters, the other protects, sized to your risk.
Market+Stop (new in v2.9.0)
Hold a key and left-click to set the protective stop — Margin-9 enters at market straight away, sizes the position from the click-to-market distance, and stages the targets. The side is automatic from where you click.
Before an entry fills, take-profit targets appear as draggable, non-fillable preview lines (Pre-Fill Targets), and Flat-Stop Safety keeps an armed protective stop from triggering while you are still flat. See the Usage tab for the full workflows.
Haptic Feedback (MX Master 4)#
New in v3.0.0: Margin-9 can drive the haptic motor of a Logitech MX Master 4 mouse, so you can feel what just happened on your trade without taking your eyes off the chart. Each key event has its own distinct pulse — a fill feels different from a partial take-profit, a winner feels different from a stop-out.

Each event maps to its own vibration pattern so they are easy to tell apart by feel:
| Event | What you feel |
|---|---|
| Entry filled | A crisp single tap — you are in the position. |
| Take-profit (partial) | A light knock as a target fills and the position shrinks. |
| Closed — winner | A clean completion buzz when the last contract exits in profit. |
| Closed — stop-out | A sharp alert buzz when the last contract exits at the stop. |
| Protective stop armed | A firm click confirming the stop is set. |
| Warning | A ringing pulse for an invalid risk entry or an unprotected position. |
| CANCEL ALL — confirm | An alert buzz when the first click arms the “CONFIRM?” state. |
| CANCEL ALL — executed | A strong buzz when the second click strips the orders. |
Guaranteed on native Windows only
Opt-in and fail-safe
ATR & Volatility#
Since v3.1.0, Margin-9 has a built-in volatility engine based on the Average True Range (ATR) of the chart. It can show a compact ATR readout with a volatility-regime badge directly in the control panel, place your protective stops at a distance measured in ATR multiples instead of fixed ticks, and automatically reduce position size when volatility is unusually high.
ATR Panel Info
The current ATR and the volatility regime (LOW / NRM / HI) at a glance, right in the control panel (v3.1.0+)
ATR Stop Distance
A third position on the STOPS button places every stop at multiplier × ATR, so your stops breathe with the market (v3.2.0+)
High-Vol Contract Cap
Optionally trims risk-sized positions in a high-volatility regime — e.g. half size while volatility is extreme (v3.3.0+)
Off by default
See the Configuration tab for the settings and the Usage tab for the full workflow.
Multi-Symbol Support#
Since version 1.4.0, M9. supports fully independent multi-symbol operation. Each chart runs its own M9. window with completely isolated state — including risk profiles, position data, window position, and active configuration. Trade ES, NQ, and RTY simultaneously, each with different risk setups.
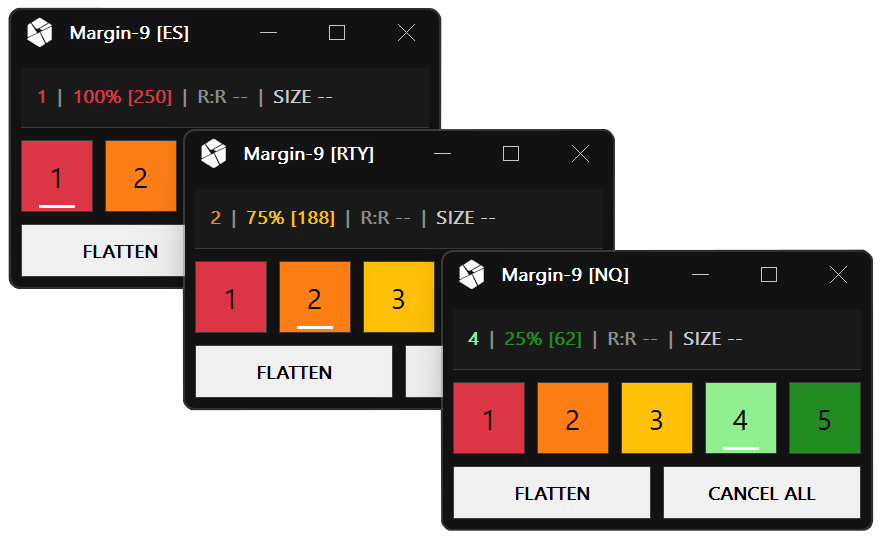
Independent Windows
Each chart gets its own floating control panel with isolated state
Persistent Layout
Window position and active profile saved per symbol/chart
Per-Symbol Config
Different risk profiles and settings for each instrument
How It Works
Key Benefits#
Consistent Risk
Maintain the same risk per trade, regardless of stop distance
Five Entry Modes
Chart-Click, Pair Adoption, Market, Breakout, and Market+Stop — each optional, each fully managed
Flat-Stop Safety
An armed protective stop can never fire and open an unwanted position while you are flat
Precise Calculations
Advanced algorithms ensure mathematically accurate position sizing
Flexible TP Distribution
Fully customizable contract allocation across multiple targets
Quick Profile Switching
Switch between 5 different risk profiles with a single click
Weighted R:R Display
Real-time risk/reward calculation that accounts for contract distribution
4K / Multi-Symbol Ready
Full HiDPI support and independent multi-chart operation
Who is this For?#
Experience Level
Designed for intermediate to advanced traders familiar with Sierra Chart and fundamental risk management concepts. Basic understanding of bracket orders required.
Market Types
Optimized for futures trading. Supports all standard contracts (e.g., ES, NQ, CL) and micro contracts (e.g., MES, MNQ, M2K). Automatic detection of contract types.
Typical Trader Profiles
- ●Day traders who place multiple trades per session and require consistent risk management
- ●Traders who work with varying stop distances (tight scalps to wide swing stops)
- ●Traders who want to split positions across multiple take-profit levels
- ●Traders who wish to switch between different risk profiles (aggressive, conservative, etc.)