Overview#
SLS. is a professional-grade Sierra Chart study that automatically plots key reference price levels from the Prior Day session, Overnight session, Initial Balance period, Opening Range windows, and VPOC Migration states — enriched with real-time historical statistics showing the probability of each level being tested during the current Regular Trading Hours (RTH) session.
Unlike basic level-plotting tools that simply draw lines, StatLevelsSuite transforms static levels into dynamic decision-support zones by displaying the historical Test Rate for each level, conditioned on a three-dimensional model: Open Type, IB Range Regime, and ETH Range Regime.
What the Study Computes
- ●Previous day RTH session High, Low, VPOC, Mid-point, Close, VAH, and VAL
- ●Overnight/ETH session High, Low, VPOC, Mid-point, VAH, and VAL
- ●Initial Balance High and Low (60-minute IB in current v2.x model)
- ●Opening Range High/Low levels for 0.5m, 1m, 5m, 15m, and 30m windows
- ●VPOC migration targets (dH/dL) after session VPOC breaks above IBH or below IBL
- ●Regime classification: Open Type (HOR/HIR/NOR/LIR/LOR), IB Range Regime (N/R/W), ETH Range Regime (Q/A)
- ●Markov-based sequence prediction for the most likely next target
What the Study Displays
- ●Horizontal price lines for up to 27 distinct levels on the chart
- ●Statistical probability percentages displayed as labels on each line
- ●Visual differentiation through line width (thicker for higher probability) and style (dotted for lower probability)
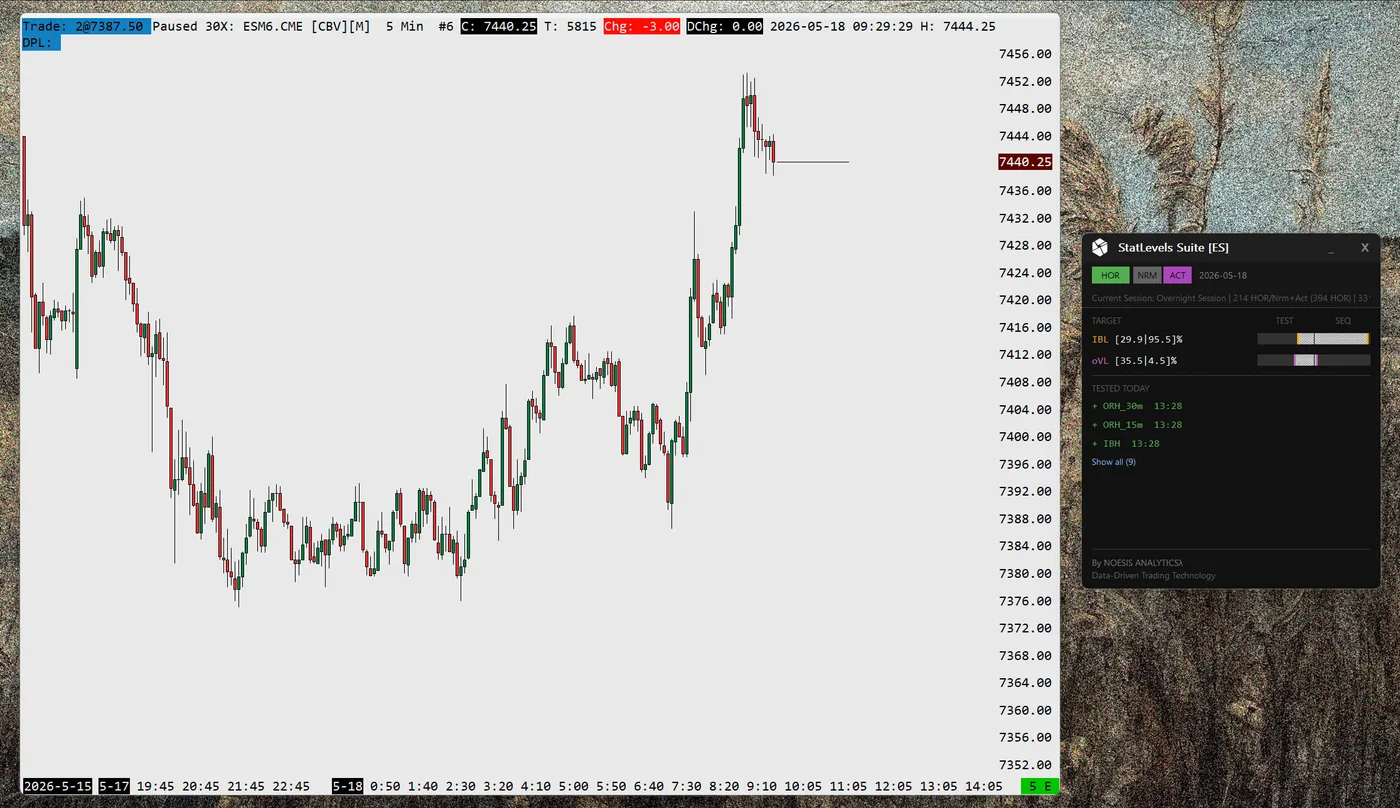
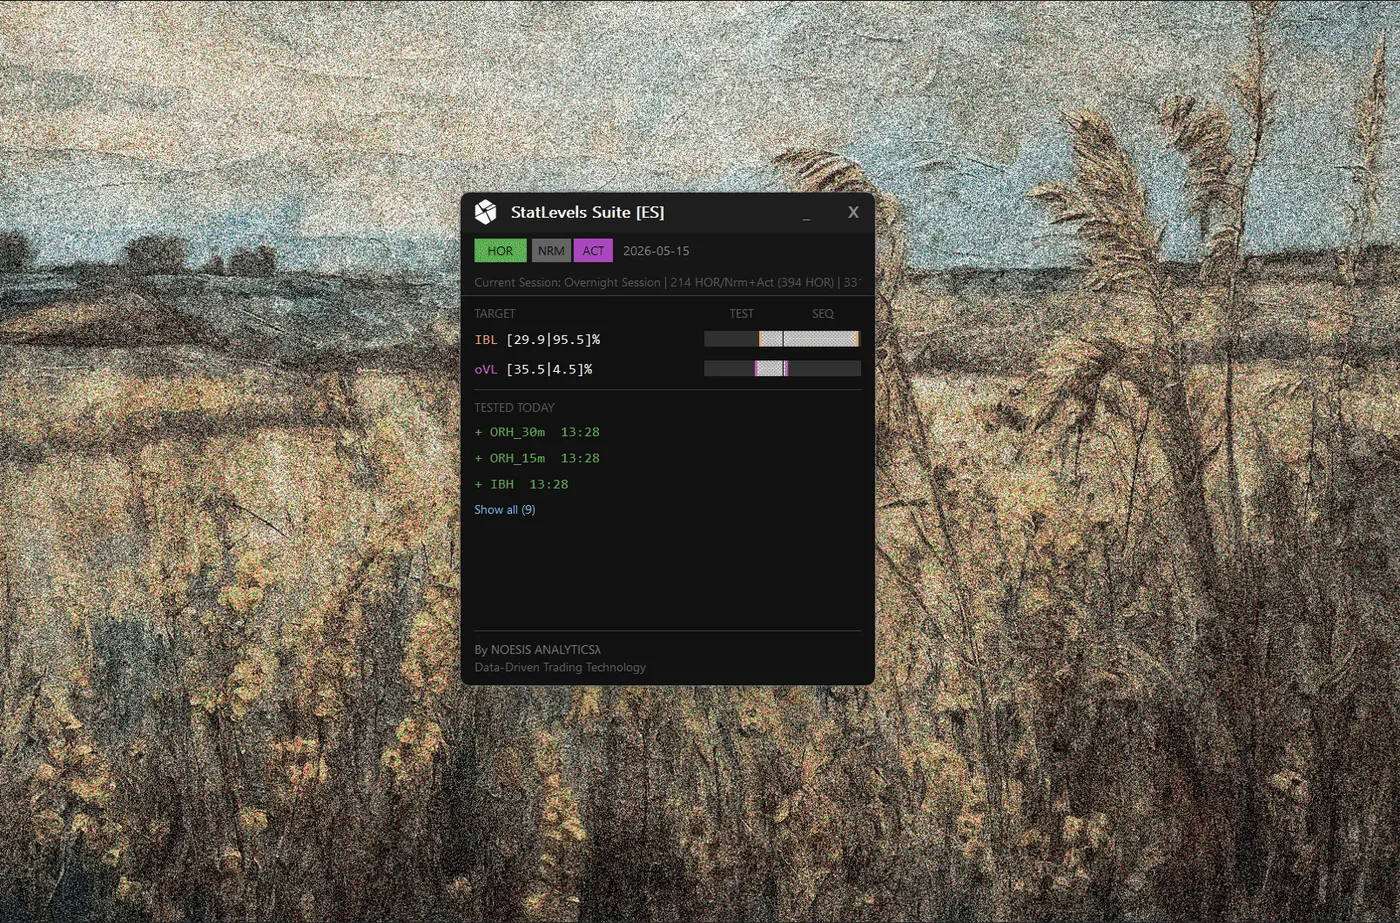
- ●Sequence Prediction Panel on-chart (draggable) with regime badge and ranked next-target list
What the Study Stores and Persists
- ●Per-symbol historical records for every trading day — Open Type, regime classification, and a full set of level-test outcomes — written to CSV and available across sessions and chart reloads
- ●Aggregated level test statistics (test rates by Open Type, IB Regime, and ETH Regime) automatically computed from SCID tick history and saved to CSV, keeping the probability model current as new days are completed
- ●Five specialized CSV exports for external analysis: historical day flags, actual level prices, aggregated statistics, intraday test sequences, and current-session levels in Bookmap-compatible format
Self-Building Statistics Database
SLS. can automatically generate its complete statistical database from SCID tick data. Load a chart with extensive history (1000+ days recommended), enable statistics, and the SCID pipeline builds your probability model.
Once initialized, the database is maintained day-to-day: new trading days are appended, gaps are forward-filled automatically, and statistics are recalculated. No manual data import is required.
Learn how to build your statistics databaseDependencies Required
Chart must have proper session time configuration. SCID data files must be available for the symbol (standard Sierra Chart setup). File system access is required for CSV operations.
Key Concepts#
Levels Computed#
StatLevelsSuite tracks 27 price levels organized into five categories:
Prior Day (7 levels)
Overnight (6 levels)
Initial Balance (2 levels)
First 60 minutes of RTH
Opening Range (10 levels)
VPOC Migration (2 levels)
Available after session VPOC migrates beyond IBH or IBL
Open Type Classification#
The Opening Type is determined by comparing the RTH Open price against the previous day's Close and High/Low boundaries:
| Code | Name | Condition |
|---|---|---|
| HOR | Higher Out of Range | Open > Previous Close AND Open > Previous High |
| HIR | Higher Inside Range | Open > Previous Close AND Open < Previous High |
| LIR | Lower Inside Range | Open < Previous Close AND Open > Previous Low |
| LOR | Lower Out of Range | Open < Previous Close AND Open < Previous Low |
| NOR | Neutral Open Range | Open = Previous Close |
Why Open Type Matters
Open Type is the first conditioning dimension. Since v2.3, probabilities are further refined by IB Range Regime and ETH Range Regime.
Regime Conditioning#
SLS. conditions probabilities across three dimensions to match daily market structure more closely:
Open Type (HOR/HIR/NOR/LIR/LOR)
Session open location relative to prior day range.
IB Range Regime (N/R/W)
Initial Balance range relative to prior day range:
- N: IB is small vs prior day range; range expansion is typically more likely.
- R: IB is proportional; balanced behavior is more common.
- W: IB already covers large relative range; mean-reversion behavior is more common.
ETH Range Regime (Q/A)
Overnight range relative to prior day range:
- Q (Quiet): ETH Range < 50% of prior day range.
- A (Active): ETH Range >= 50% of prior day range.
Composite Key and Fallback
Composite key format: {OpenType}_{IBRegime}{ETHRegime} (for example HOR_NQ, LIR_WA).
If a composite bucket has fewer than 15 historical days, SLS. falls back automatically to unconditional Open Type statistics.
Sequence Prediction Panel#
The Sequence Prediction Panel uses a Markov transition matrix of historical level-test sequences and ranks the most likely next target.
- ●Conditioned on the composite regime key (Open Type + IB Regime + ETH Regime)
- ●Bayesian-smoothed probabilities with sample-size-aware shrinkage and confidence curve
- ●Ranking formulas include Bayesian Logit Blend (Formula 3) and Robust Shrunk Ensemble (Formula 4)
- ●Fallback hierarchy: Composite Regime Bucket -> OpenType Bucket -> Aggregate Bucket
Panel tuning options (v2.4.14+)
- Time-Adjusted Test Rates: the panel's TEST rates can be conditioned on the time of day — the probability a still-untested level gets tested before the session ends. Chart labels always stay full-day rates.
- Absolute Sequence Rates: instead of renormalizing next-target probabilities to 100%, the panel can show raw transition probabilities that deflate honestly late in the day.
- Recency Half-Life: recent trading days can be weighted more heavily than older ones in the statistics and transition matrices.
All three are configured in the Sequence group of the study settings — see the Inputs tab.
VPOC Migration Targets (dH/dL)#
dH and dL are dynamic targets activated by session VPOC migration across IB boundaries:
| Code | Activation | Meaning |
|---|---|---|
| dH | Session VPOC migrates above IBH | Probability of forming a new day high |
| dL | Session VPOC migrates below IBL | Probability of forming a new day low |
Statistics Model#
The primary statistic is the Test Rate — the percentage of historical trading days where price reached and tested a given level during RTH.
Individual Test Rate (Exact)
The percentage of days where this specific level was tested.
Example: "pH 67.5%" means that on 67.5% of days with this Open Type, price tested the Prior Day High.
OR-Statistic (Combined)
For paired levels (High/Low pairs), this represents the probability that at least one level of the pair is tested.
Example: "pH or pL 89.2%" means on 89.2% of days, price tested either the Prior Day High OR the Prior Day Low (or both).
AND-Statistic (Conditional)
When one level of a pair is tested, the remaining level receives the AND-statistic — the conditional probability of reaching the second level given that the first was already tested.
Example: If pL is tested first and pL's stat becomes 0%, pH's statistic updates to the "pH & pL" rate — the historical frequency of testing both levels.
Visual Probability Encoding
| Test Rate | Line Width | Line Style | Meaning |
|---|---|---|---|
| ≥ 75% | 2 pixels (thick) | Solid | High-probability target |
| 31% - 74% | 1 pixel (normal) | Solid | Moderate significance |
| ≤ 30% | 1 pixel | Dotted | Low probability — de-prioritize |
| 0% | 1 pixel | Dotted | Already tested |